
A statistical approach to winning the early snowfall competition.
By: Steffan Lloyd (2013/11/15)
This past Saturday, on November 9th, a wonderful event took place: it was the first snowfall of the season! Also it was both my, and fellow XC Ottawa'er Andre Marchand's birthday! Congratulation to Barb Hesk, who correctly guessed the date of the first snowfall.
For those who guessed incorrectly, youre probably thinking: where did I go wrong? What was wrong with my analysis? How can I win next year? What am I going to eat for dinner? What is my purpose? Am I insignificant? Does anything have meaning?
Have no fear, fellow amateur meteorologists. I have taken a bit more than half an engineering degree, so I think Ive got enough science learnt to do a scientific analysis of what the best snowfall guess is. And with that, I might be able to answer the first few of those questions.
The first thing you need to consider when trying to predict the most likely snowfall date is temperature. Without a below zero temperature, its not gonna snow. Thankfully, Environment Canada has the raw weather data going back 20 or so years, available for download. Using this data, we can plot the average temperatures in October and November, using data from 2006 through to 2013. The thick blue line represents the average temperature for the last 9 years. All the data in this lab comes from a weather station located at the Experimental Farm, in Ottawa.
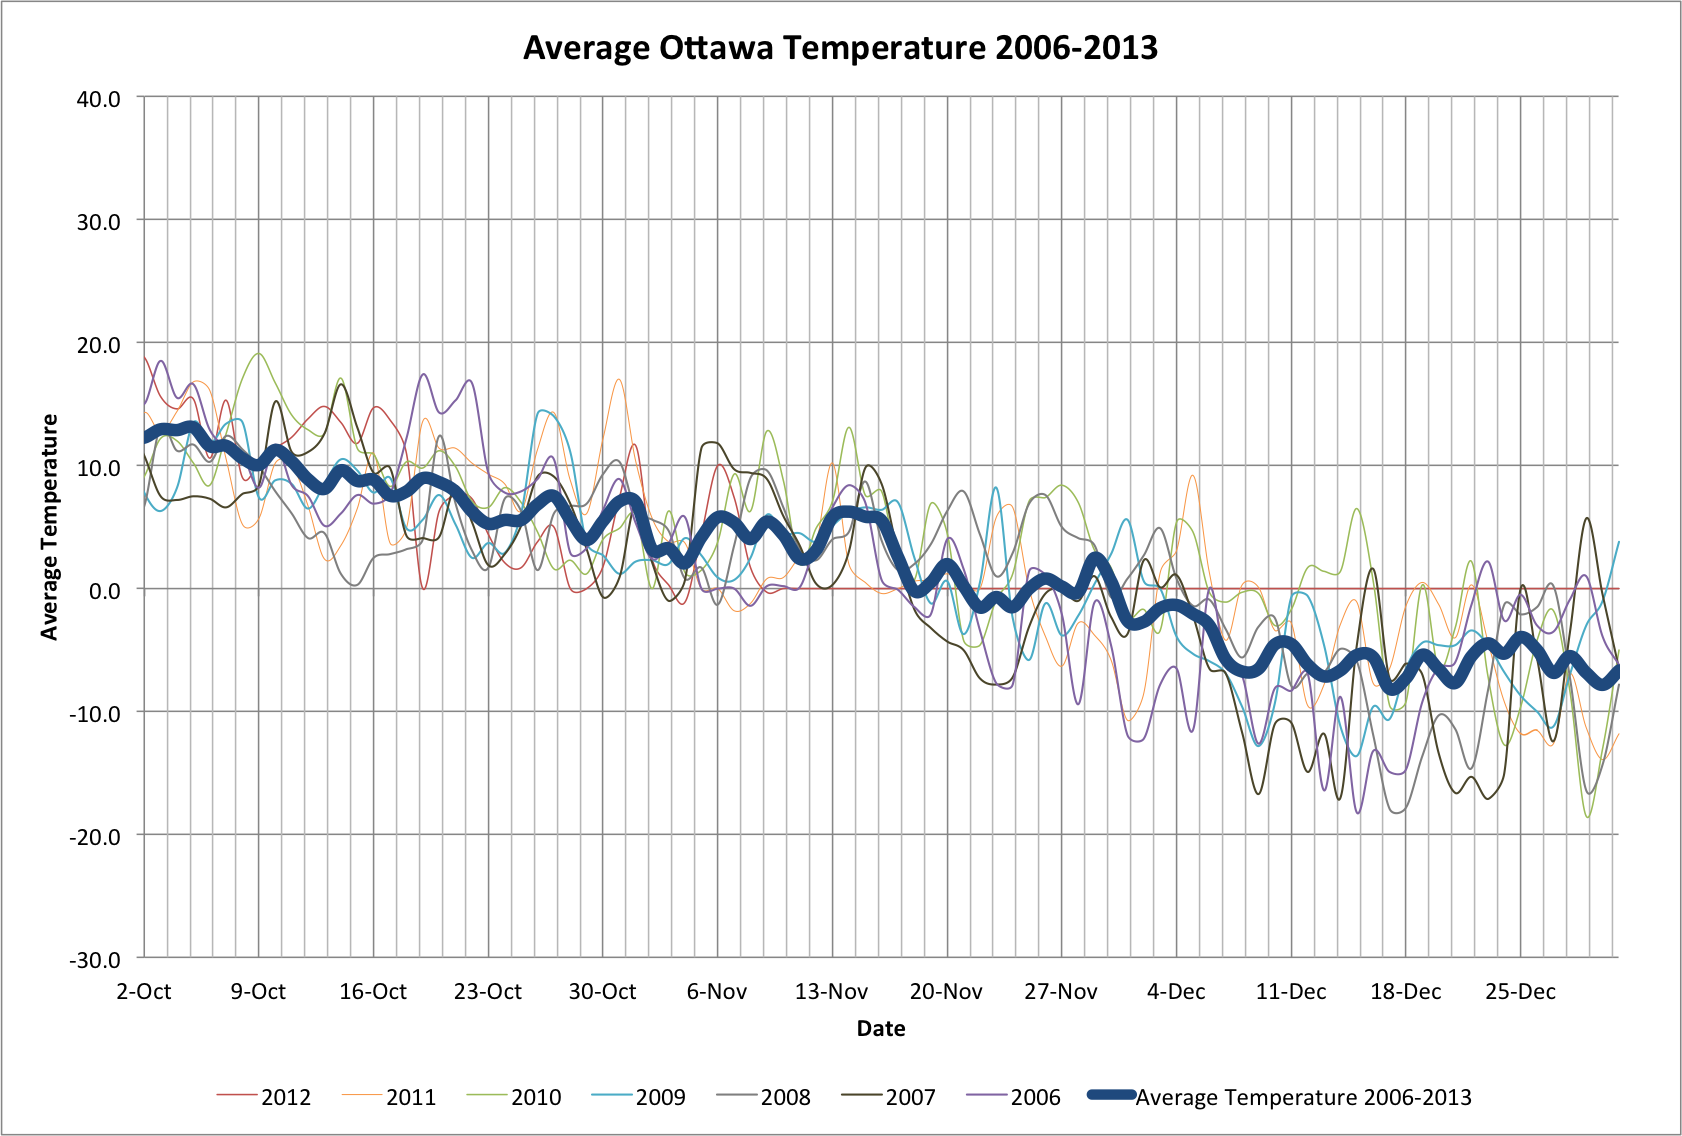
Unfortunately, this data isnt actually very helpful for us in guessing the first snowfall date. Since the mean temperature averages out the cold spells that occur each year, the temperature usually starts going below zero far before the average temperature does you can see in this graph that the average temperature goes below zero around Nov 20th, the temperatures for each year start dipping below zero around the 30th of October.
Much more useful for us to know is the chance on a given day that it will snow. To do this we calculate 2 things: The chance on a given day that it will rain, and the chance on a given day that the temperature will be below zero. With this, we can calculate the chance that both these things will happen on the same day i.e. that it will rain, and be below zero, on the same day. This data is plotted below:
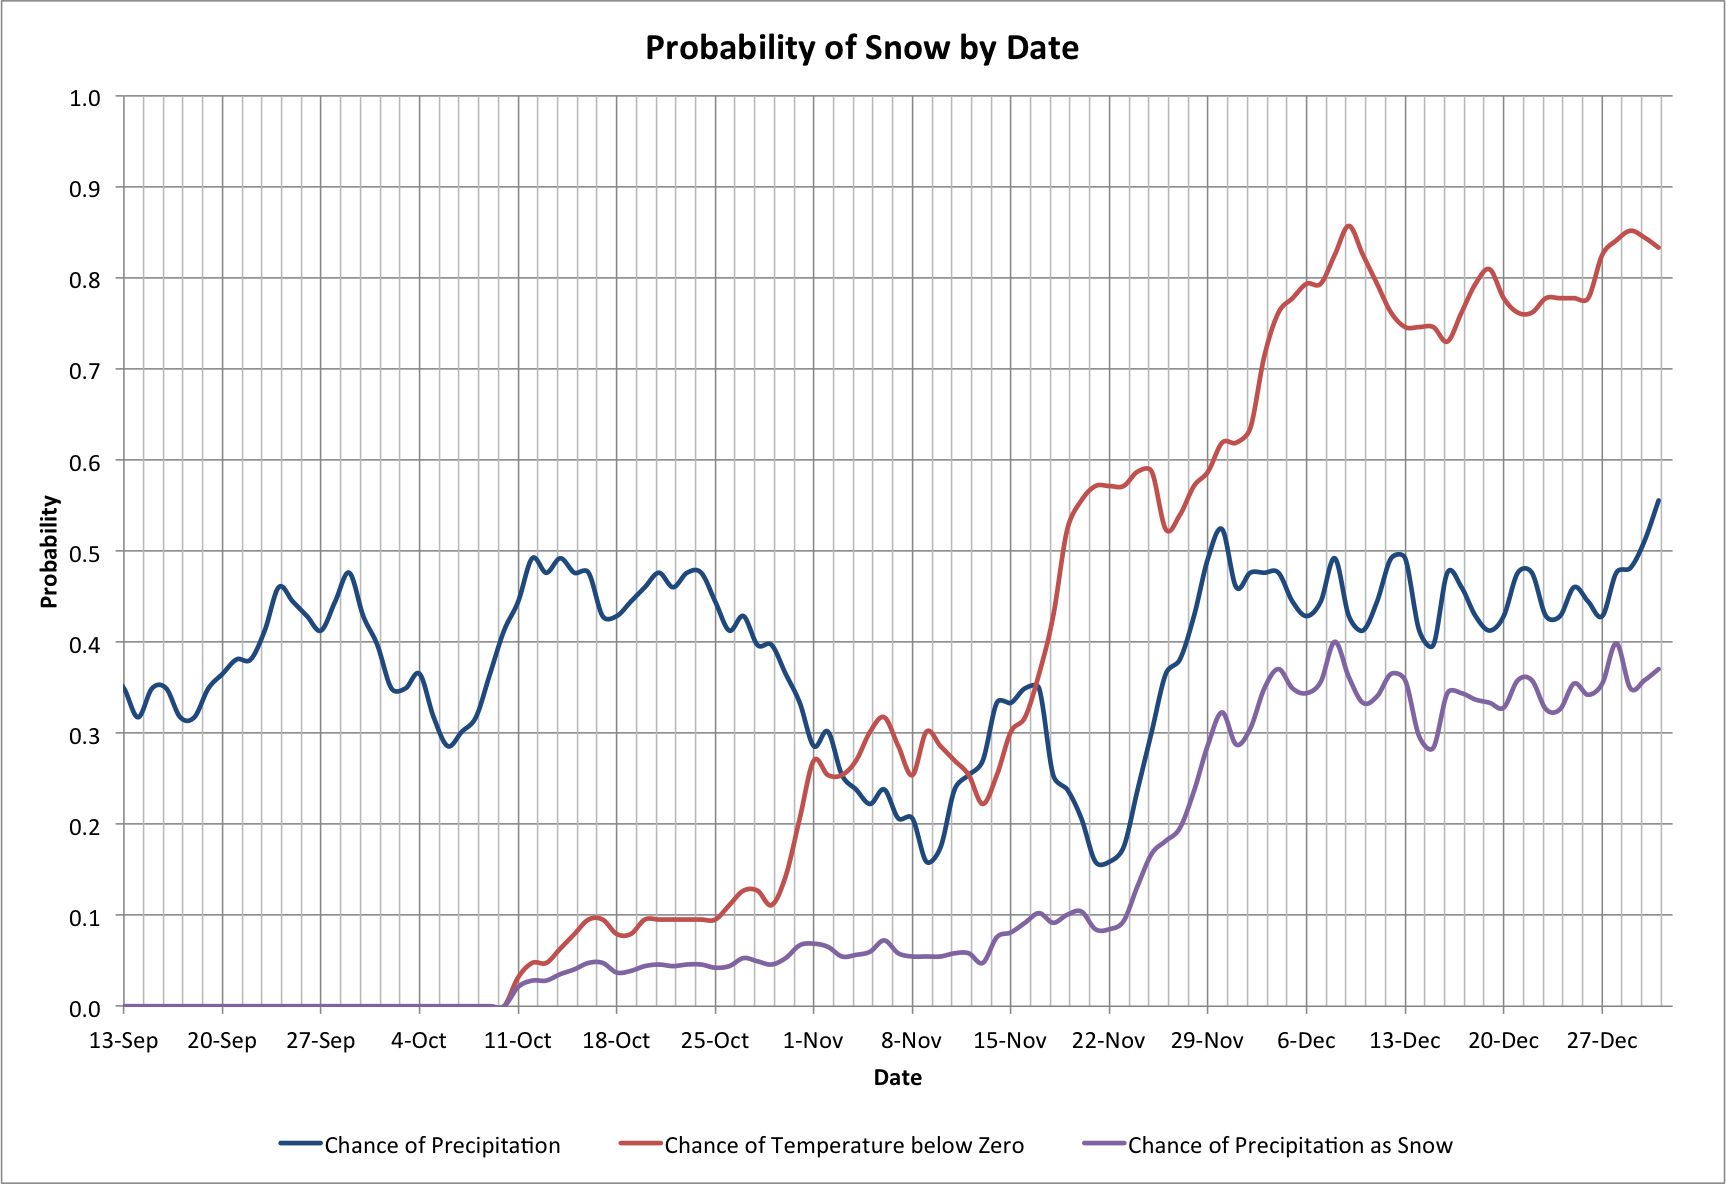
The blue line represents the chance on a given day of rain, the red line represents the chance of it being below zero, and the purple line is the combination of these two lines, and represents the probability of snow on a given day. We see that the probability for snow on a given day is around 7% at the end of October and the start of November, then it jumps up to almost 40% chance every day near the end of November.
This gives us the chance of snow on a given day, but what we really want to know is the chance that by a certain date, will it have snowed? We can actually find this by calculating a running summation of the probability of snow for a given day. This is what we in engineering call an integral.
Below Ive plotted this running integral, the chance of snow having occurred by a given date (in blue). For comparison, the red crosses represent the winning guesses for the past 8 years. Furthermore, the red line represents the guess distribution i.e. the average number of guesses each year for a given day.
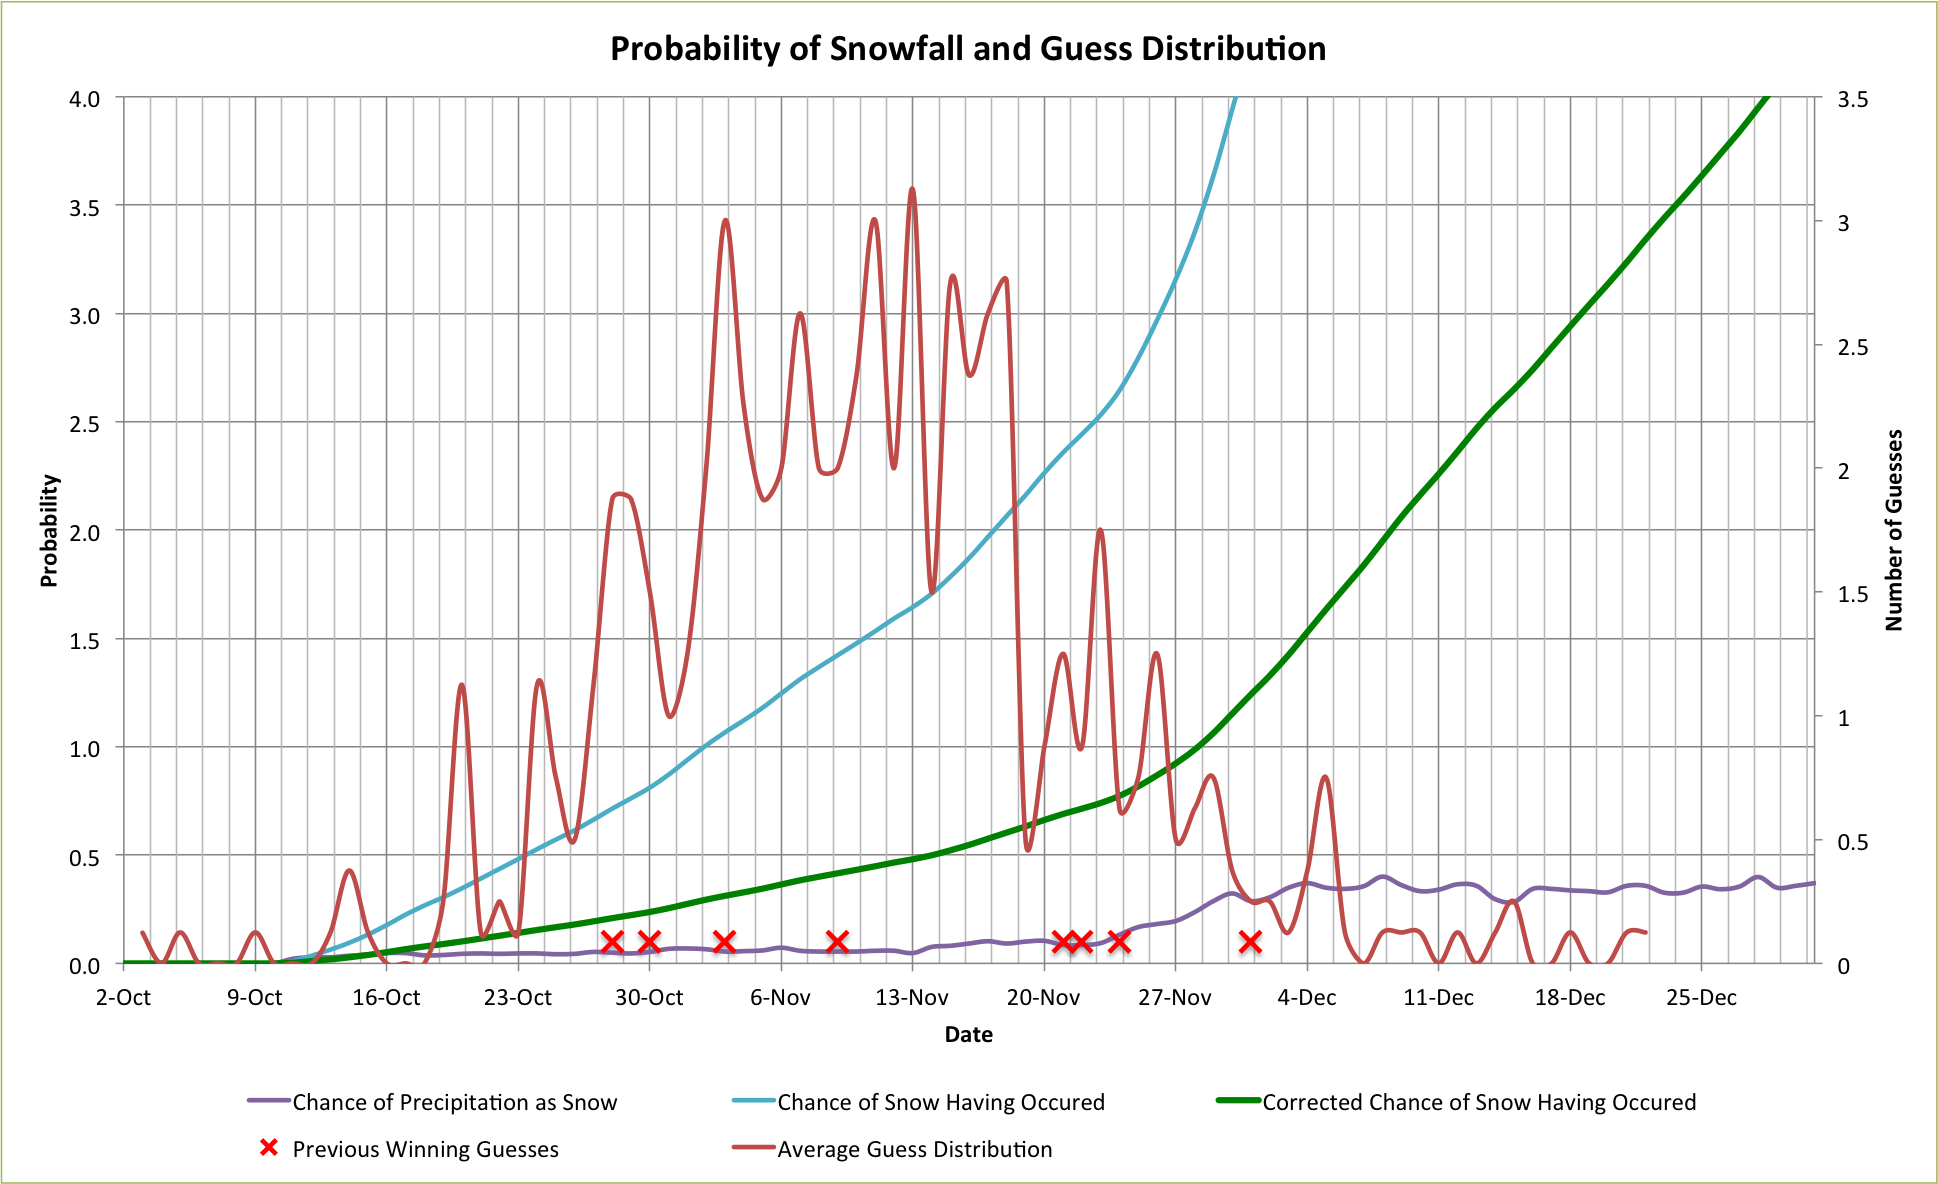
From this plot we can see a few things. For one, there are some very optimistic and pessimistic people out there. You can see that at there were a couple guesses on October 2nd, and same in late December
In this model, when the probability reaches 0.5, the chances are greater it will have snowed than that it will not have. This occurs on Oct. 23rd. However, we all know that it snows a few times, just flurries before the actual snowfall occurs. Therefore a correction factor will have to be applied to this probability curve. The average of the winning snowfall dates is the 14th of November. Adjusting the probability to match 0.5 probability with that date, we apply a correction factor of 3.42. This gives us the green curve, which gives a very accurate probability analysis of when the first snowfalls will occur. We see that some of the dates occur a bit early, at 20-25%, and some occur as late as 115% - indicating that for that point the probability that it hadnt snowed at that point was very slim.
This green line is the line is the important one. Based on our data, this is the best possible indication of when the first snowfall will occur. If you want to pick the most likely date, choose the date when this curve reaches 0.5 probability. If you like to live dangerously, you might pick a value further away from 0.5, like the date at 0.3 or 0.8. Don't pick a date where the probability is 0, or greater than 1. You'll be wrong.
We can compare this data to actual snowfall readings in Ottawa. This data isnt as accurate, as actual snow on ground occurs in Chelsea usually much before it occurs in Ottawa. However, its still pretty interesting.

Lastly, it is pertinent to look at how the date of the first snowfall has changed in the past 8 years that this contest has taken place. This is pertinent for predicting the first snowfall dates for future years. The plot below shows this data.
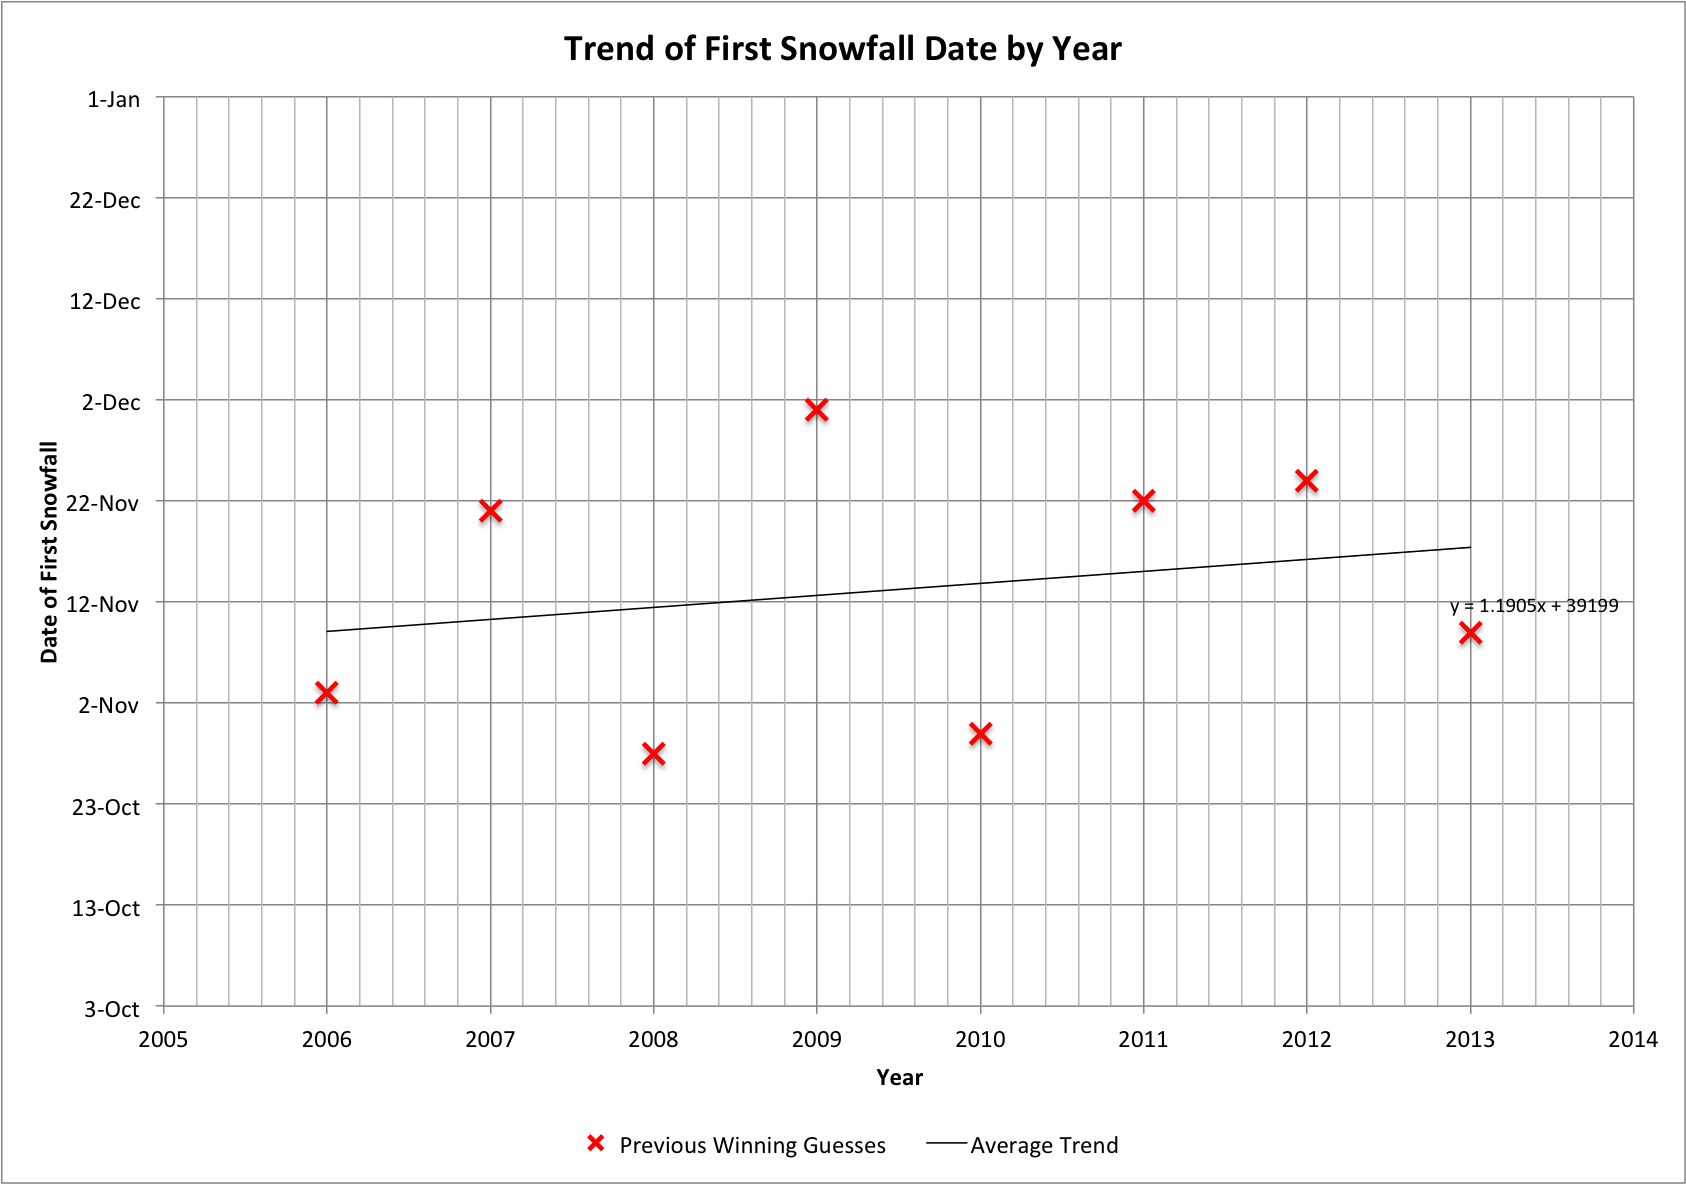
Here we see a clear upward trend in the guesses. Over the past 8 years, the first snowfall date has been steadily increasing by 1.19 days every year.
The implications of this are two-fold. For one, next year you may be saying, oh, Ill guess November 14th because that was the 50% probability point for snowfall occurring on the corrected probability line. But youd be wrong. Since the average snowfall date increases by 1.19 days on average next year, the correct proper guess will be for November 15.19th.
Secondly, this graph confirms the question of whether global warming is happening. Clearly, with such a delay each year in the average snowfall date, one couldnt argue with this fact. I hope that this finding will have profound implications in the way we live to conserve, to preserve, and to find new sources of energy to stop this trend.
I hope this helps with your guesses from next year. I also hope it will reduce the amount of horrible October 2nd or December 20th guesses.
EDIT: Former XC Ottawa member Colin Abbott astutely pointed out that the implications of this graph are dire: by the year 2047, we will stop seeing white christmas's. Please click here for the necessary sound effects associated with this realization.
References
Environment Canada. (n.d.). Monthly Climate Summaries. Retrieved 11 11, 2013, from Climate: http://climate.weather.gc.ca/prods_servs/cdn_climate_summary_e.html.

"Simply put, Podiumwear is the best custom team uniform apparel in the World."